The map and the timeline
Every session opens on a map with your GPS track — the sailing you actually did, not a reconstruction. Below it, a timeline lays out the session in lanes: races, legs, tacks and gybes, and any custom segments, in the order you sailed them.
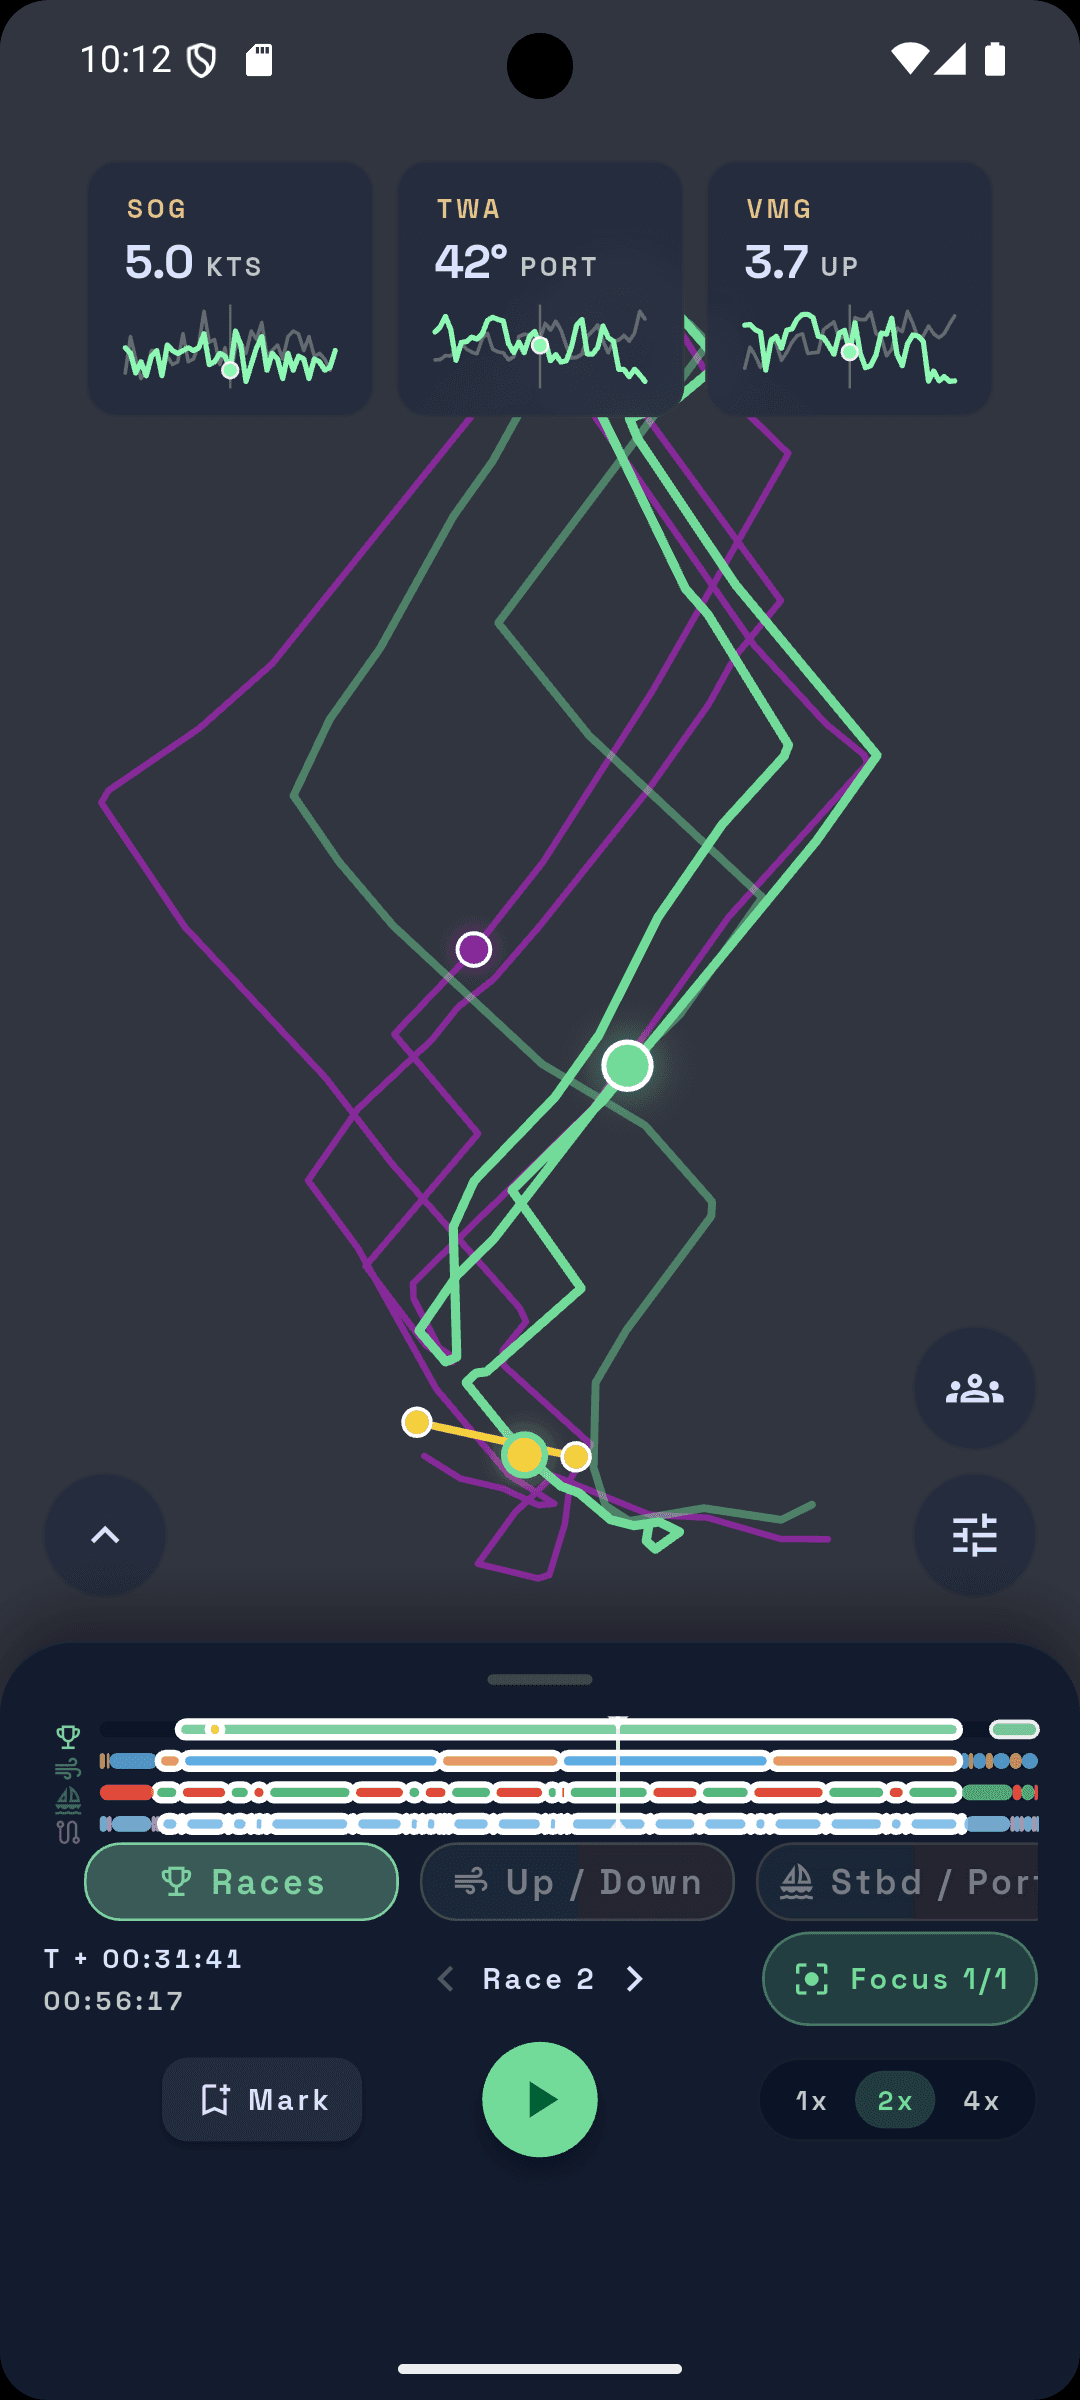
Filter & focus
tip
Tap into the timeline to filter the whole page: a race scopes the map and stats to it, "upwind" shows every upwind leg, a tack narrows to port or starboard alone. The map redraws to match.
Speed and VMG
Broken down by point of sail — upwind and downwind, port and starboard — with top and median speed, median VMG, and median wind angle for each.
Manoeuvres
Every tack and gybe SailLab detects gets timed, with speed lost and how quickly you got it back, against your fleet's average.
Adjusting the manoeuvre window
The window each manoeuvre is measured over — seconds either side of the turn — is adjustable, from 10 seconds up to two minutes, tack and gybe independently.
Custom segments
note
Mark a stretch of a session by hand — a good beat, a bad start — with a label and optional note. It gets full metrics for exactly that time range. Up to 20 per session.
Replay
Plays your track back, boat by boat, at speeds up to 32x. A follow button locks the camera on your boat; sail-number labels identify every boat, and a distance scale tracks the zoom as you pinch. A crosshair marks where each boat was at the starting gun. The telemetry graph — VMG, speed over ground, wind angle — minimises into a corner badge, and back on tap.
The overview numbers
Total distance, top speed, average VMG, and how your speed was distributed across the sail — the first thing you see, before filtering into anything more specific.